

(This is the third post in a series on Fractured Atlas’s capacity-building pilot initiative, Fractured Atlas as a Learning Organization. To read more about it, please check out Fractured Atlas as a Learning Organization: An Introduction.) I don’t know about you, but I’ve always been a reluctant decision maker. When I go out to eat at a restaurant, I often drive my dinner mates crazy by asking the wait staff for recommendations and then just ordering what I was thinking about getting anyway. In high school, I used to agonize over what now seem like trivial choices like what topic I should choose for my English papers. Perhaps that’s why I’m so drawn to the science of decision-making.
I’m somebody who likes options, who likes variety. As soon as I make a decision, I close myself off to a world of possibilities. So I want to be sure I’m making the right one! As much as anything else, making the right decision has to do with accurately forecasting what will happen once you make it. The trouble is, a lot of times we are pretty uncertain about just what those consequences might be. In the previous post in this series, I talked about how we frequently use too narrow a range of possibilities when trying to make a prediction about something we’re not sure about. In part that’s because our society — and perhaps our brains — have trained us to think deterministically rather than probabilistically.
What that means in plain English is that when we make a guess, we typically hone in on one option. If you’re a contestant on Jeopardy! and the category is Tom Cruise movies, you can’t chime in with “What is either Magnolia or Top Gun, I’m not sure?” You gotta pick one. And that’s true of decision making as well, isn’t it? In the end, there’s only so much you can hedge your bets. We only get one life to live (well, that we know about) and we are accustomed to choosing a single path from the many in front of us. The thing is, though, if we want to make smarter decisions, we need to train ourselves to be a little more comfortable with ambiguity. Sure, that course you took last fall seems like a slam-dunk right choice in retrospect, but did it look that way before you decided to sign up? What if it hadn’t worked out the way you’d hoped?
The funny thing about decisions is that sometimes you can make the right call and still have things turn out badly — or vice versa. Improving the decision-making process is a long game — it banks on the idea that, over time, and across many decisions, you’re going to come out ahead for approaching each one thoughtfully. And thoughtful decision making involves defining the assumptions and potential consequences of your decision carefully and considering the full range of possibilities associated with each. Forecasters have long been using a tool called Monte Carlo simulations to help us do just that.
The Monte Carlo method was invented by a physicist named Stanislaw Ulam and was originally used to help design atomic bombs. (The codename “Monte Carlo” comes from the legendary casino in Monaco, where Ulam’s uncle used to gamble.) More recently, the method, which typically involves running thousands (or sometimes tens or hundreds of thousands) of simulations on a model and then aggregating the results, has shown up in everything from computational biology to corporate finance. Data scientist and former New York Times blogger Nate Silver, who famously predicted the 2008 and 2012 presidential election results with near-perfect accuracy, relied on a sophisticated Monte Carlo model to do so.
Using Monte Carlo methods within a decision-making context enables us to make predictions about the consequences of those decisions, and thus better understand the opportunities and risks associated with them. At Fractured Atlas, where we’ve set up an internal team to experiment with this sort of decision modeling, we’ve begun to hone the process for bringing quantitative definition to our decision dilemmas and making predictive estimates. Below, I’ll lay out the steps we currently use to do this.
- Define what your dilemma actually is. For many people, this exercise is fairly intuitive, but sometimes it takes a little bit of work to get your decision to a state where it can actually be modeled. Something like “what should I do with my life?” is not really at that place yet. But let’s say you’re deciding whether or not to move your office to a bigger space. That’s a very clear, specific dilemma that a process like this one can help resolve (with a bit of elbow grease).
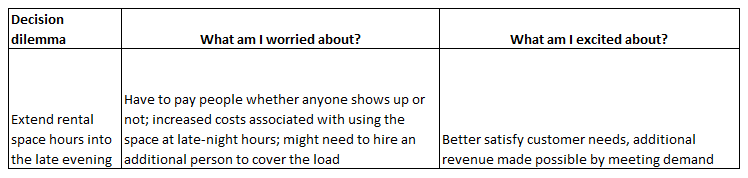
- Articulate what excites you, and conversely, what worries you about this decision. If we had perfect information all the time about what was going to happen in the future, decision making would never be a source of stress. In fact, it would be very boring! What causes us to worry about making the wrong decision is that hard decisions always carry some sort of risk, opportunity, or combination of the two. Translating your emotions about the decision into words will help you understand the criteria by which the decision will be judged successful or not, and what factors could affect the outcome.
- Define the “central question” for the decision and identify the relevant variables affecting it. This central question needs to be understood in quantitative terms and usually boils down to some sort of cost-benefit equation: for example, will the amount of money I earn from the points on this credit card exceed the annual fee? Alternatively, the central question might weigh two options against each other: does a change in the business model for my program yield better results than the status quo? Once you know what your central question is and have identified the elements of the decision that you care about most, the next step is to define variables — things like the number of people attending your event, the expected cost of a new software feature, and the like. The variables should collectively work together to create an equation that ultimately answers the central question.
- Estimate values and distributions for the variables. For each of the variables in the model, we need to give our model some sense of what the numbers might be. For example, you might be 90% confident that the proportion of folks who will buy a book after they hear you speak is somewhere between one-tenth and one-third. This is where the calibration training mentioned in the previous post comes in handy. If we’ve learned anything about estimating ranges, it’s that we need to make sure to make them wide enough!
- Run the Monte Carlo simulation. We set up Excel to run 10,000 individual scenarios, each one a plausible real-life outcome according to the assumptions we’ve set up in our model. The model aggregates the results of each of those to tell us, out of those 10,000, what percentage ended up answering the central question a certain way. And now we have a prediction of how our decision is going to turn out!
I imagine this must all seem kind of abstract, so let’s run through the process again with a concrete example. Let’s say you run a rental space and you’re deciding whether or not to extend your hours later into the evening. You’re excited because a lot of customers have been requesting to rehearse at those hours, and there’s a reasonable expectation that the change is going to bring in more revenue. On the other hand, you’re worried that the fixed costs of staffing the space during the late-night hours, whether it’s being used or not, will outpace any incremental dollars you might bring in. The central question is one of simple costs and benefits: is extending the hours going to be worth it in the end?
Defining the incremental costs of the change should be fairly simple. Most of it will have to do with labor. If you pay your people hourly, it’s as simple as the additional hours you’ll have to pay out due to the extended schedule. You may want to account for the possibility that you’ll need to hire an extra person to handle the load; in that case the drain on your time to find that person should be considered as an upfront cost. If you want to get a little fancier, there may also be increased utility costs (electricity, etc.) that you’ll incur as a result of the increased usage of the space, as well as increased wear-and-tear that could be expressed as faster depreciation. Defining the benefit side of the equation happens much the same way. Do you have only one rental rate for all your customers? Then it’s just a matter of estimating how many new customer-hours will be enabled by the schedule extension and calculating how much they will pay for those hours. Things get a little more interesting if you have lots of different rates for different customers and uses — e.g., rehearsal vs. recording, non-profit vs. for-profit, etc. In that case, you’ll want to segment those customers out by their different properties, and calculate how much new revenue is generated by each type.
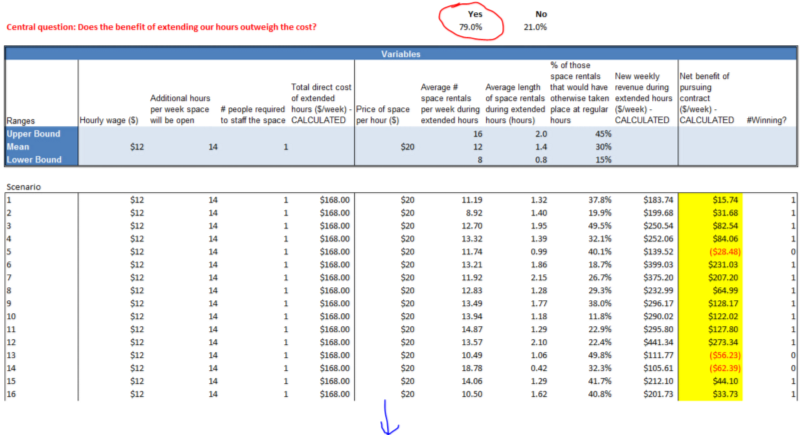
Ultimately, we end up with a set of estimates for the potential costs and benefits of following through with your decision. The Monte Carlo simulation can then calculate, out of those tens of thousands of scenarios, how often the decision turned out to be the right one. Basically, it’s offering you a recommendation on which path to choose — kind of like the waiter who confidently tells you to get the saltimbocca. Just don’t be like me and order the chicken anyway! If you’d like to see the formulas and play with the numbers yourself in the example above, you can download a simple version of it here.
.svg)